
What is your WordPress version? And PHP? How many posts do you have? Status reports gather all those information in a single place. Just copy and paste, and answer all the support questions at once. But what do we do when the report is not easy to read?
Asking the same questions over and over again
Asking or answering the same questions is too boring, everybody agrees. Everybody also agrees that the solution for repeated tasks is automation. If the system knows all the answers, why not get them directly from the source, saving everybody’s time? Status or system reports are meant for this.
If the system knows all the answers, why not get them directly from the source, saving everybody’s time?
Status report pages are already common in the WordPress ecosystem. Go to a specific page, click on a button, and paste it into a ticket. The report isn’t always that legible but I’ve created a tool to help with that.
The Report Parser Tool
Status pages are divided into sections containing lists of key-value pairs. In WordPress, for example, we have the “WordPress” section, and some keys are “Version”, “Site Language”, etc. The copy-and-paste report shared with support follows the same format but it gets really hard to read when the value is too big. Imagine a JSON object, for example.
The Report Parser helps with that problem: just paste the report into the textarea and it is possible to see it formatted with collapsible sections.
The idea to create the tool came after we added the new Status Report page to ElasticPress 4.4.0. There we aggregate answers for lots of common support questions, like the last failed Elasticsearch queries.
With these Elasticsearch queries, I noticed a problem: common lists are easy to read but bigger JSON objects are not. The tool serves as a way back: keep both the easiness of copy-and-paste reports and readability for support teams.
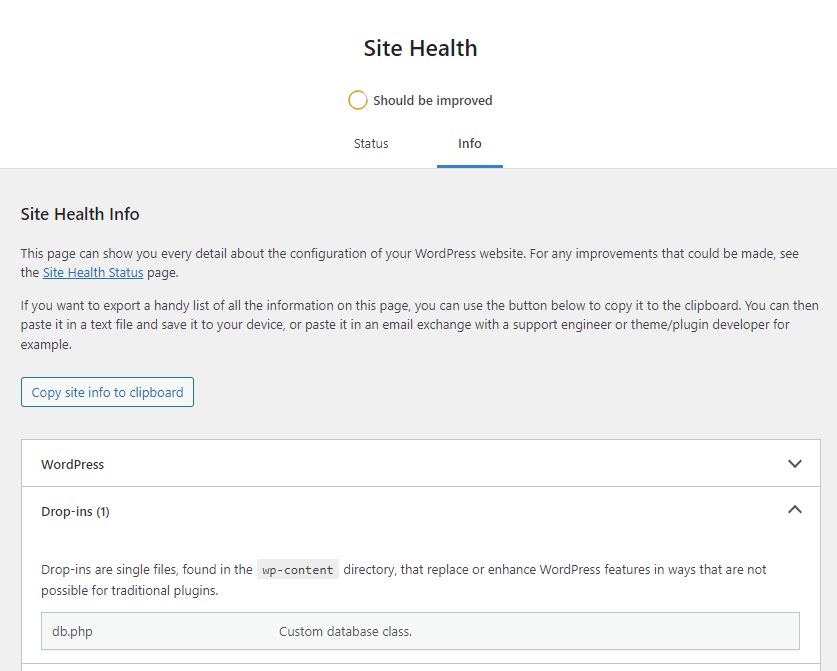
WordPress Site Health Info
WordPress 5.2 added a new page with Site Health Info, previously only available via the Health Check plugin.
The Report Format
After you click on the Copy site info to clipboard button, a report like the one below will be available to be pasted:
### wp-core ###

version: 6.1.1
site_language: pt_BR
user_language: pt_BR
....

### wp-dropins (2) ###

advanced-cache.php: true
object-cache.php: true
As you must have noticed, the basic structure is:
### <section_name> ###

key_1: <value_1>
key_2: <value_2>
Report Parser gets that format and transforms it back into collapsible sections and formatted tables.
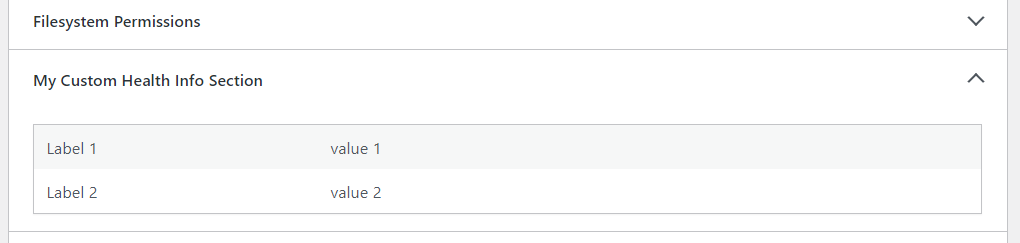
How to add your own sections to the WordPress Site Health Info page
Well, as we are already here, let’s see how simple it is to add a new section with your plugin or theme info. All we need is to use the debug_information filter, returning the array with a new index.
function my_custom_health_info_section( $debug_info ) {
	$debug_info['section_slug'] = [
		'label'  => __( 'My Custom Health Info Section', 'textdomain' ),
		'fields' => [
			'field_slug_1' => [
				'label' => __( 'Label 1', 'textdomain' ),
				'value' => 'value 1',
			],
			'field_slug_2' => [
				'label' => __( 'Label 2', 'textdomain' ),
				'value' => 'value 2',
			],
		],
	];

	return $debug_info;
}
add_filter( 'debug_information', 'my_custom_health_info_section' );
The code above creates a new section, like the screenshot below:
In the copy-and-paste report, our section looks like this:
### section_slug ###

field_slug_1: value 1
field_slug_2: value 2
Status reports in plugins
Some plugins have their own status reports. That happens because they were created before WordPress added this functionality or because their reports are so complex that they don’t fit into the WordPress structure, which has only one level of hierarchy.
WooCommerce
WooCommerce’s System Status is available under WooCommerce > Status.

Some sections stand out there, like Database, Settings, and WooCommerce pages, super specific to the plugin. In WooCommerce, the copy-and-paste report stays visible, different from almost all other solutions available.
Gravity Forms
Gravity Forms’ System Report is available by going to Forms > System Status.
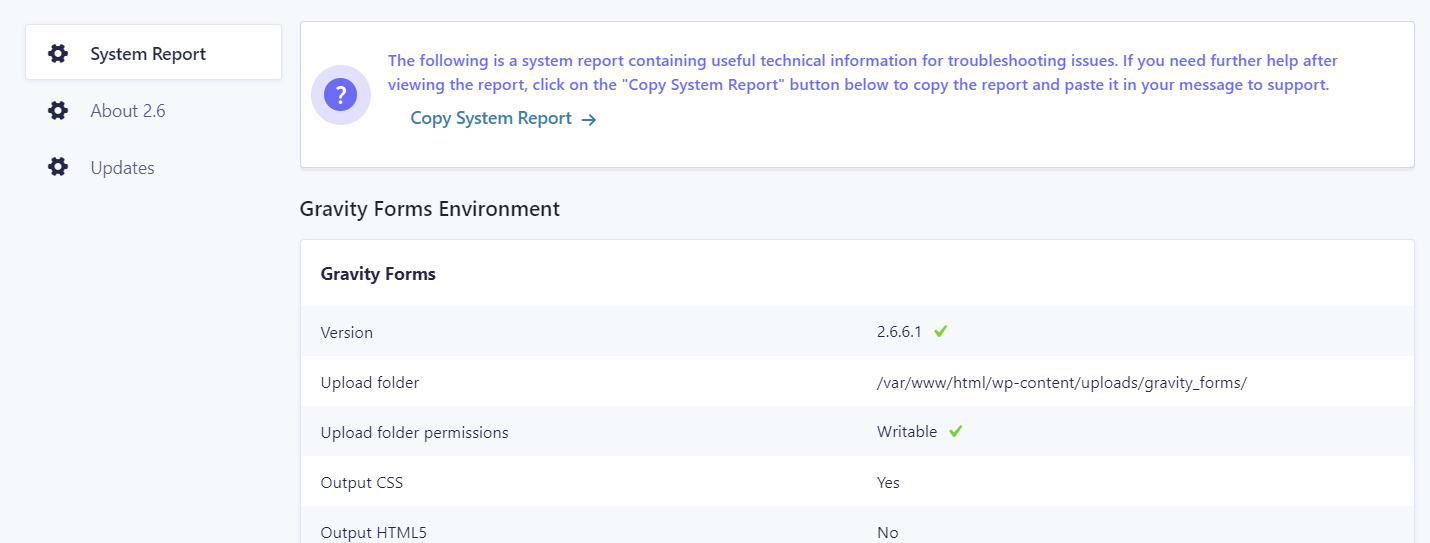
In addition to a section called Gravity Forms, the section Database (pretty much like WooCommerce’s) lists all the plugin custom tables.
ElasticPress
The ElasticPress Status Report page was born from a support need and was inspired by several existent solutions.

In addition to extremely specific sections like Indexable Content, Elasticsearch Indices, and Last Sync, the ElasticPress report has another difference: an extra hierarchy level. There we have the WordPress section, for example, with the WordPress Environment and Server Environment subsections.
Conclusion
In this post we saw a new tool called Report Parser, available here in the blog, to better visualize WordPress and its plugins’ Status Reports.
We had a look at the Health Info from WordPress itself, the standard format used in all reports, and how it is possible to add your own section to WP’s report.
At last, we saw some plugins that have their own reports like WooCommerce, Gravity Forms, and ElasticPress.
Don’t forget to share the post and subscribe to the newsletter!